You may have heard these rumblings recently: ‘We’re still going to see declining prices.’
But I’m not convinced.
Yes, it’s true, local foreclosure filings jumped, reportedly 46% in the first half of 2012 compared to last year. So that’s the bad news. But what about all the good news?
What good news, you ask?
It’s the diminishing gap between listings and sales, it’s the increasing number of properties sold each month, it’s the stable to increasing prices in six out of eight price brackets of condominiums and single family homes.
Much of the data that does get reported is generalized and doesn’t paint a clear picture. Case in point. Three days ago, a story in the Sun News, the local daily newspaper, stated,
“The median price of a single-family home sold along the Grand Strand dropped 2 percent, to $159,900, in the first half of the year compared to the same period last year, according to the MLS. The median price of a condo dropped 3 percent, to $107,000, in the first half of the year compared to the same time in 2011, according to the MLS.”
Ouch. At first glance you think, condo prices fell 3% and houses dropped 2%.
But using the same MLS data, if you break it down by price points, it looks much different. Five price points actually increased over the last year (one by 9%), one remained unchanged, and only two decreased:
|
Single Family Median Sale Prices: 6 Months: January 1 – June 30 |
|||
|
Price Range |
2011 |
2012 |
Percentage Change |
|
$000,000 – $150,000 |
$110,000 |
$112,925 |
+ 3% |
|
$150,001 – $300,000 |
$205,000 |
$205,000 |
No Change |
|
$300,001 – $450,000 |
$350,000 |
$359,000 |
+ 3% |
|
$450,001 & Up |
$625,000 |
$593,900 |
(-5%) |
|
Condominium Median Sale Prices: 6 Months: January 1 – June 30 |
|||
|
Price Range |
2011 |
2012 |
Percentage Change |
|
$000,000 – $150,000 |
$ 82,000 |
$ 80,000 |
(-2%) |
|
$150,001 – $300,000 |
$198,000 |
$200,000 |
+ 1% |
|
$300,001 – $450,000 |
$350,000 |
$351,800 |
+ 1% |
|
$450,001 & Up |
$550,000 |
$599,900 |
+ 9% |
So let’s see what’s really going on.
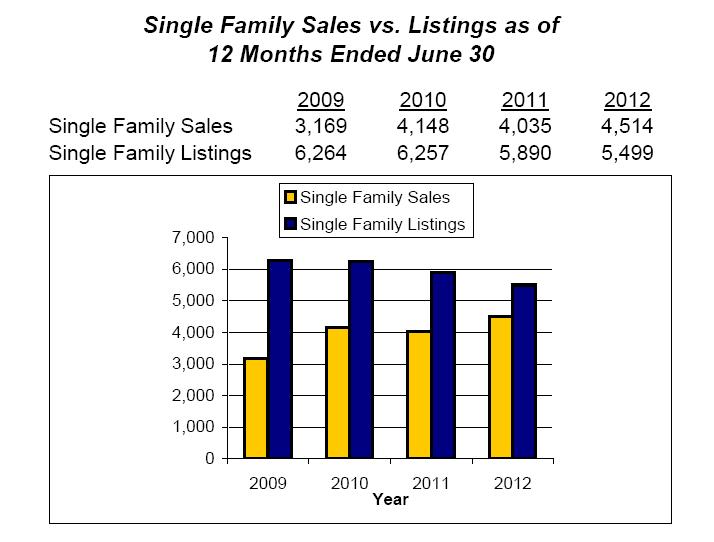
1) Ratio of Sales to Listings: 12 Months ended June 30
Take a look at the progression over the last four years.
- In 2009, out of 6,264 single family listings, there were only 3,169 sales. That’s a 51% sales-to-listings ratio.
- In 2010, that ratio improved to 66%
- In 2011: 69%
- In 2012: 82%
Likewise, the ratio of sales to listings has vastly improved for condos over the last four years:
- 2009: 6,773 listings compared to 2,458 sales = 36% ratio of sales to listings
- 2010: 57%
- 2011: 71%
- 2012: 79%
| ◄ Previous | Page 1 of 2 | Next ► |


