5 Key Indicators Measure the Myrtle Beach Real Estate Market
By Kay Van Hoesen, Posted July 8, 2012
You can’t miss all the national news about increasing real estate prices. Last month, the S&P Case Shiller housing index reported an overall upward trend for the third straight month. And according to a July 3 report from Trulia, nearly 30 cities have been designated “in the clear” of the housing downturn.
A number of warm-weather “sand state” markets have led ongoing price rallies, including Miami, Tampa, Las Vegas, Los Angeles, San Diego, San Francisco, and Phoenix. Phoenix prices have increased 12% in the last six months.
Obviously, Myrtle Beach, a “sand town,” is no where near the size nor metropolitan status of these big, sand-state cities, but this resort destination experienced a similar boom/bust driven by speculative buying. And historically, the Myrtle Beach real estate market has followed pricing trends similar to those in Miami and Tampa.
So where is the Myrtle Beach market, statistically?
While it’s not all roses, it’s shaping up pretty darn good.
Market Conditions: Myrtle Beach and Grand Strand
All data derived from CCAR, Coastal Carolinas Association of Realtors
1. Number of Housing Units Sold
June stats are not yet finalized, but May sales were up sharply. Single family home sales increased 17% from the same month last year, and condo sales were up 12% from the prior year. However, in April, sales were down 3% and 8%, respectively. And in March, single family sales were up only 1% while condo sales were down 10%
2. Pricing Trends
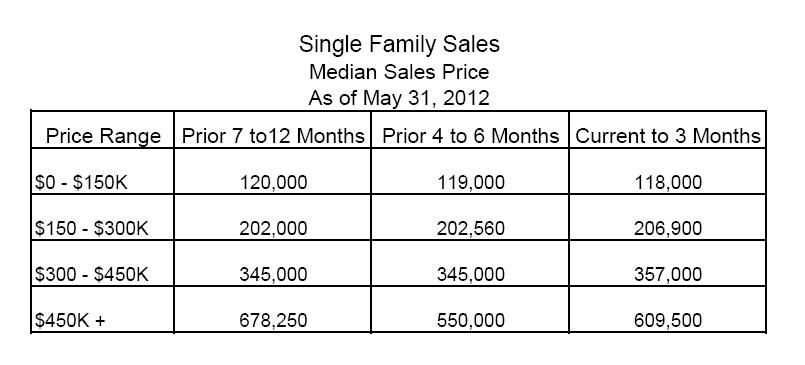
By and large, for properties priced under $450,000, median single family and condo prices have been stable to increasing over the last 12 months (more statistical detail HERE). The only category to show a decline has been condos and houses priced over $450,000.

| ◄ Previous | Page 1 of 2 | Next ► |
