By Kay Van Hoesen, Posted July 8, 2012
3. Ratio of Sales to Listings
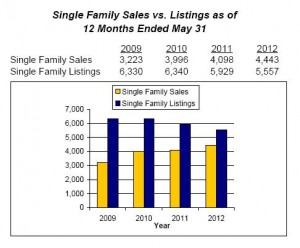
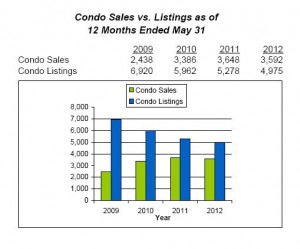
When you look at these graphs, you can’t help but feel optimism about the Myrtle Beach market. Here’s why. In 2009, the ratio of single family sales-to-listings was only 51%. That ratio has improved year-by-year to the current ratio of 80% for the 12 months ended May 31, 2012. Likewise, among condos, the ratio has improved from only 35% in 2009 to 72% in 2012.
4.Housing Supply
Among real estate professionals, it’s widely acknowledged that a six-month supply represents balanced inventory. How is supply measured? Divide the current number of available listings by the absorption rate (median number of sales per month).
Currently, among both condos and single family, a 13-month supply exists. However, and this is a BIG however, many sellers have way overpriced their listings with pie-in-the-sky expectations. As a result, their listings linger on the market and skew the data. A better indicator is the median number of days it takes to sell a listing, because the sensibly-priced listings are the ones that attract buyers.
5. Median Days on Market for Properties Sold
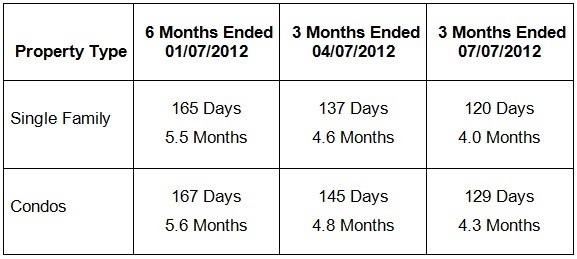
Notable are the declining days on market; i.e., the median number of days it took for a listing to sell. Here you can see the days on market over the last year have declined from 5.5 months to 4 months for both condominiums and single family homes.

Provided there are no cataclysmic events or there’s not another round of foreclosure shadow inventory entering the market, all indicators point to a Myrtle Beach real estate market poised for a rebound.
| ◄ Previous | Page 2 of 2 | Next ► |
Sign up for “First to Know” alerts. Click HERE
_____________________
Every month the trusted experts at Certifax scour the market, analyze and report the best below-market real estate bargains
Most are 10% to 25% below recent prices
Are you a member of The Certifax Report?


